Temperature Chart
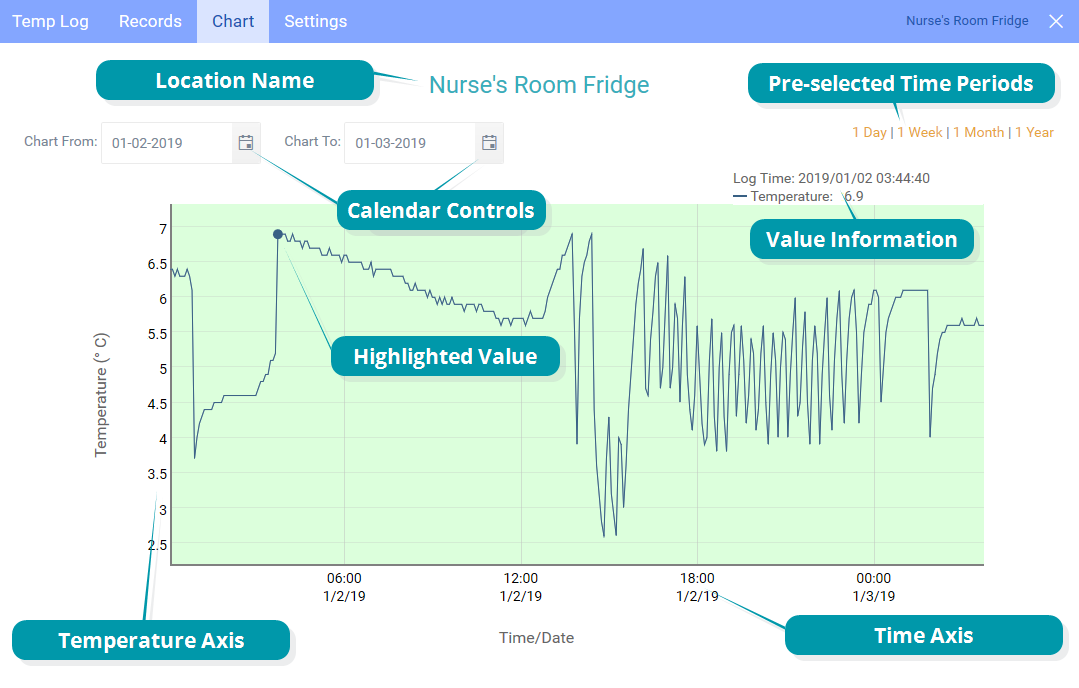
To view a location's temperature data as a line chart click Inspect in the location block on the Dashboard, then click the Chart tab. If you wish to view the temperature data from a file (uploaded from a logger not attached to a location), click the file name in the LogTag® Drive file list.

When you point to any area on the chart line, the value and time/date information for the corresponding temperature point will be shown above the chart.
You can view different parts of the chart, using several different methods.
-
Zooming in
You can view the chart in more detail by zooming in. Drag the mouse pointer horizontally across the area you wish to magnify. The temperature axis automatically adjusts to cover the range of the zoomed readings. Double-click anywhere in the window to zoom out again.
-
Using the pre-selected time periods
Click one of the pre-selected time periods to show data for only that period. If there are fewer data than the period selected, only those data will be shown.
-
Using the calendar controls
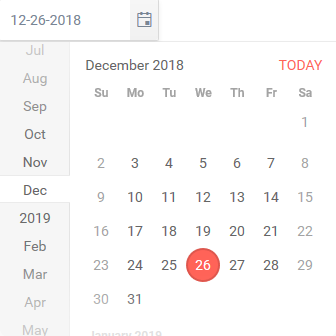
Show the chart between two selected dates. Click either calendar icon and select the desired start and end dates.

Alarm shading
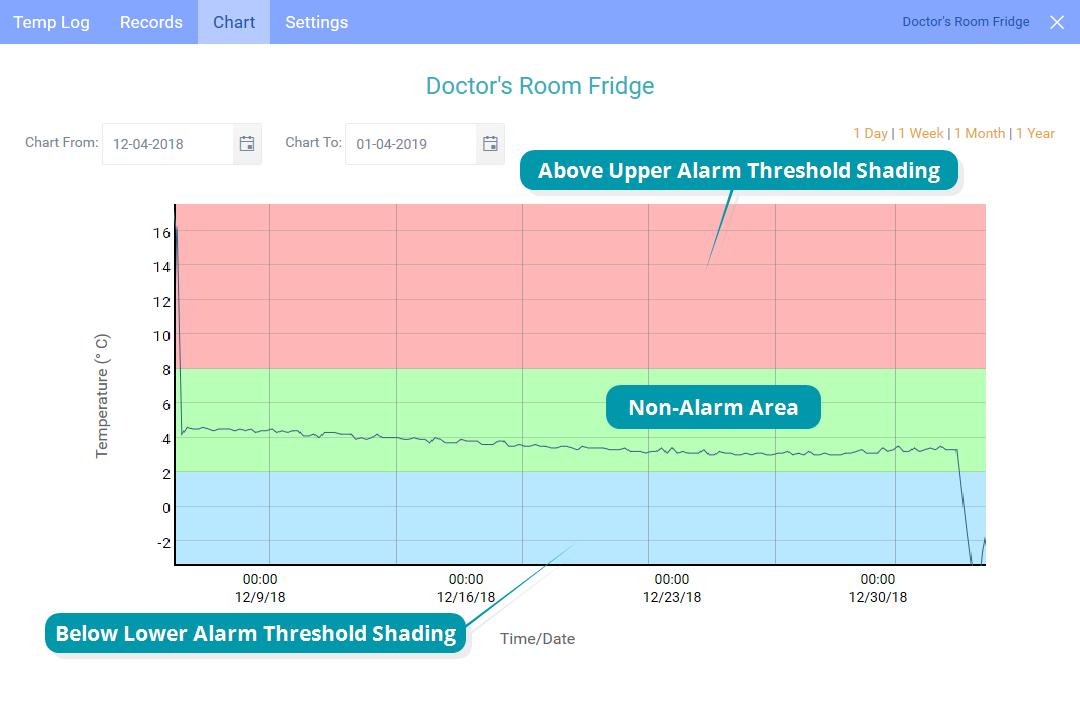
If the logger uploading data to a location or file is configured to trigger an alarm, the areas above and below the threshold values are shaded differently.

For the values inside the Non-Alarm Area the chart shading is green.
For values above the upper alarm threshold the chart shading is red. Readings recorded in this area are hotter than allowed.
For values below the lower alarm threshold the chart shading is blue. Readings recorded in this area are colder than allowed.
HAXO-8 Temperature and Humidity Loggers
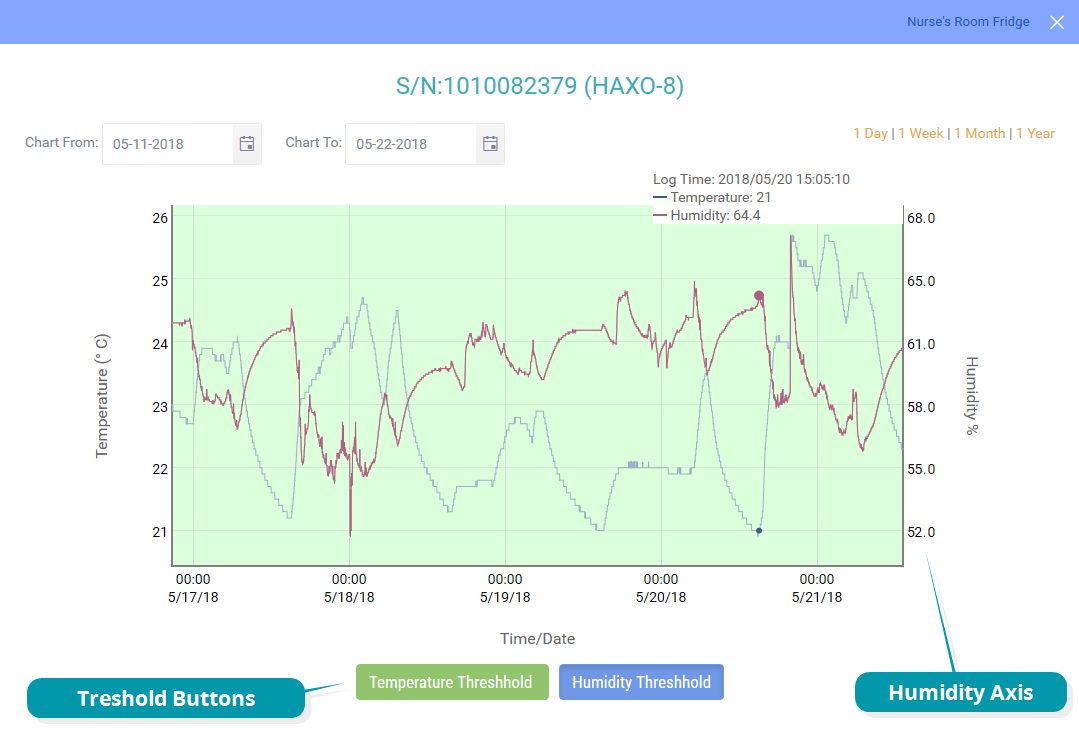
If the data you wish to view have been recorded by a HAXO-8 logger, the humidity data are shown in addition to the temperature data.

When viewing a HAXO-8 logger, you can choose to show the shading for the Temperature Thresholds or the Humidity Thresholds.